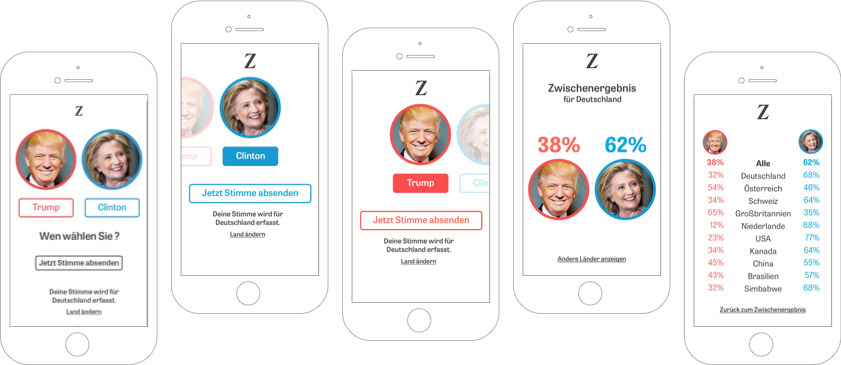
In 2016 I was selected for a fellowship of the Google News Initiative during which I had the opportunity to work 3 months inside the newsroom of German newspaper Zeit Online in Berlin.
The fellowship was my introduction to the field of data journalism, where I was able to contribute my previous experience in software development, data visualisation and interface design.
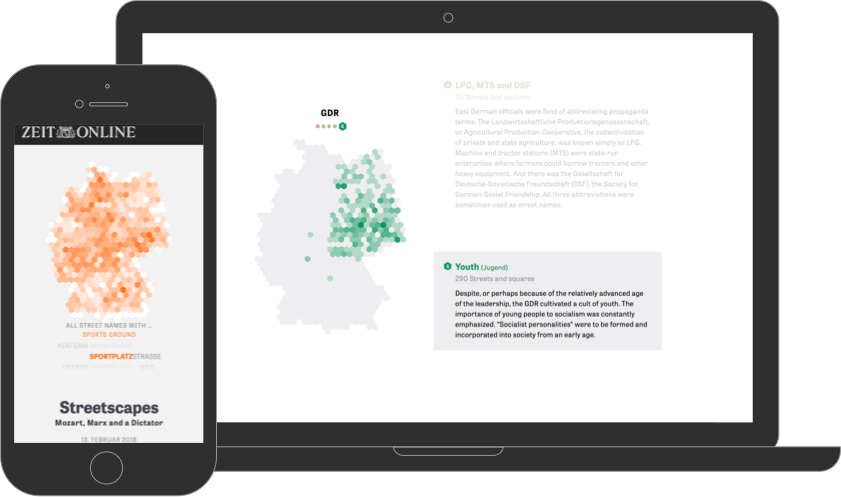
The most exciting project I was contributing to was “Streetscapes” – a joint project between the ressorts „Investigative/Data“ and „Interactive“.
Streetscapes was awarded the “Information is Beautiful Award” in 2018, the most prestigious award in the field of data visualisation.
The dataset
The starting point for the project was a dataset containing about 450.000 street names in Germany. An exciting source for linguistic, cultural and historical analysis!
“Streets and squares are an archive of both language and history. We suspected that their names would reveal patterns, and we wanted to make them visible. Doing such a thing is impossible using conventional map tools because none of them .”
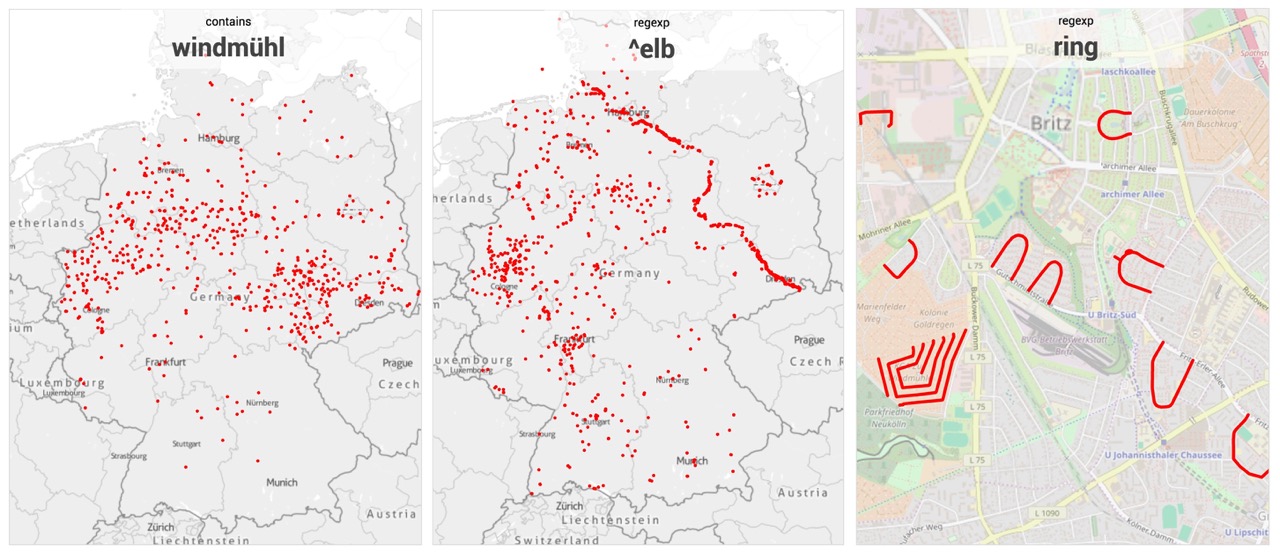
Challenge: A custom map tool
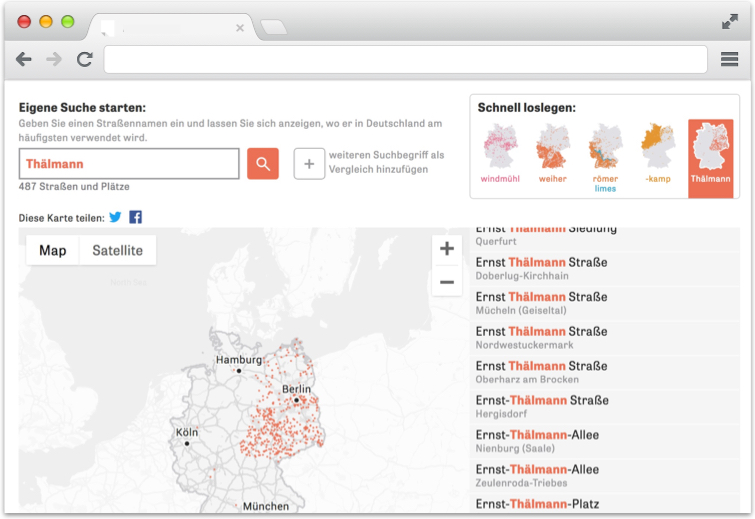
Conventional map tools pose certain restrictions on how to view and query geodata. We needed to create a custom tool that would show you all of the streets and squares of the same name at the same time.
A custom user interface and specialized data queries would support the journalists in finding patterns and stories in the dataset.
What I did
I developed the prototype for this custom map tool. The result was a web app for analyzing a given dataset of geodata (streets and squares) with regards to geographical and linguistic patterns using e.g. regular expressions. The frontend was written in Javascript/Jquery and the Backend in Python (Django/Geodjango).
At the beginning my tool was used only internally by journalists of Zeit Online. After a design overhaul the tool was made available for all readers too.
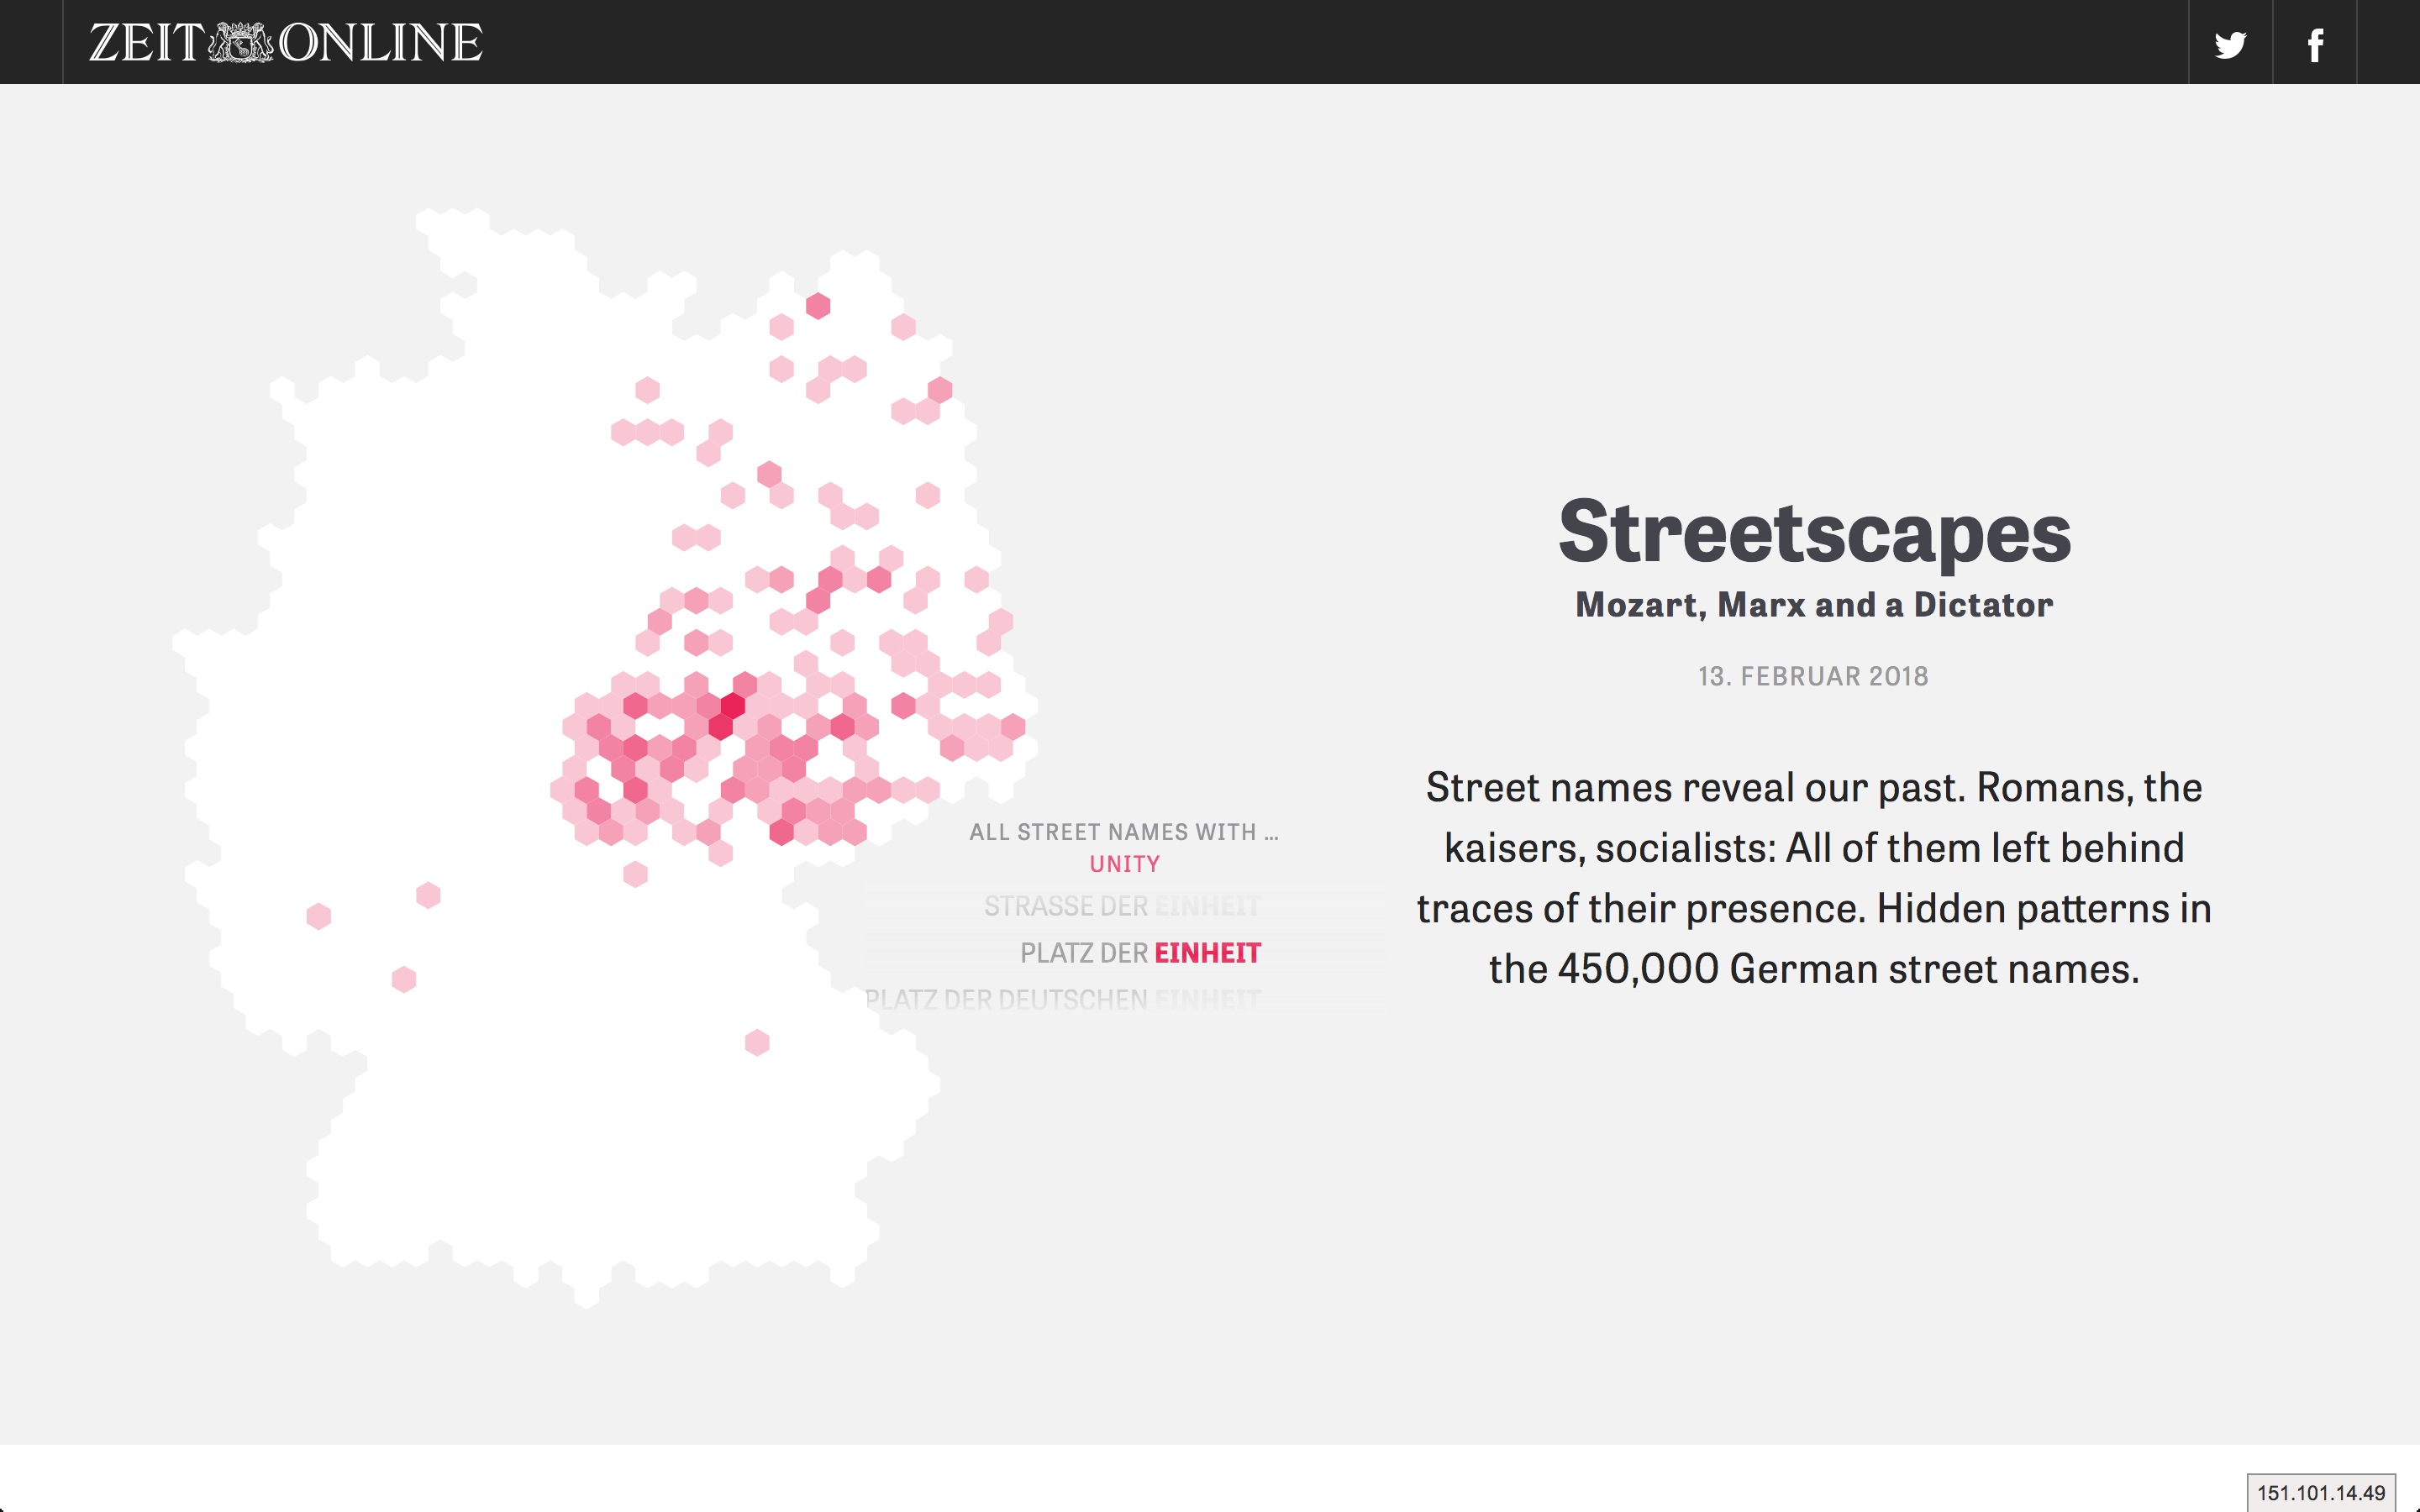
Award-winning project
But this research tool was actually only the basis for a much bigger publication by Zeit Online „Streetscapes“ which earned an Information is Beautiful Award in 2018. It was also nominated for the Grimme-Online Award.
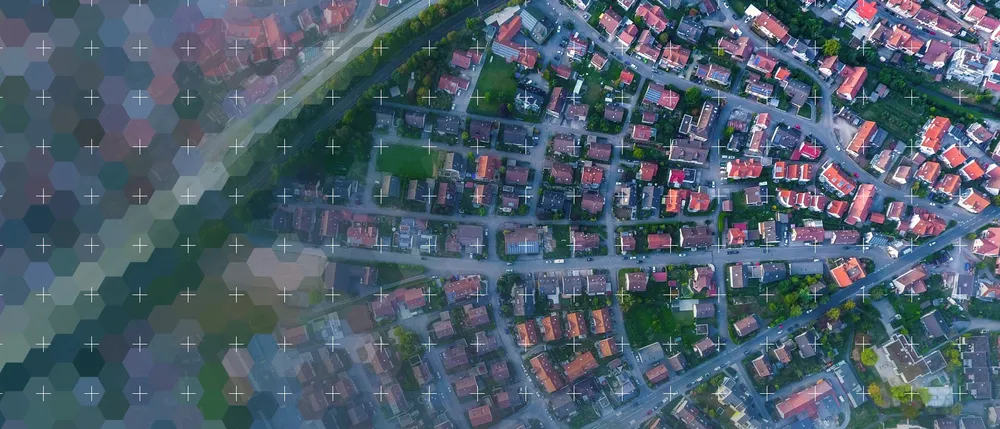
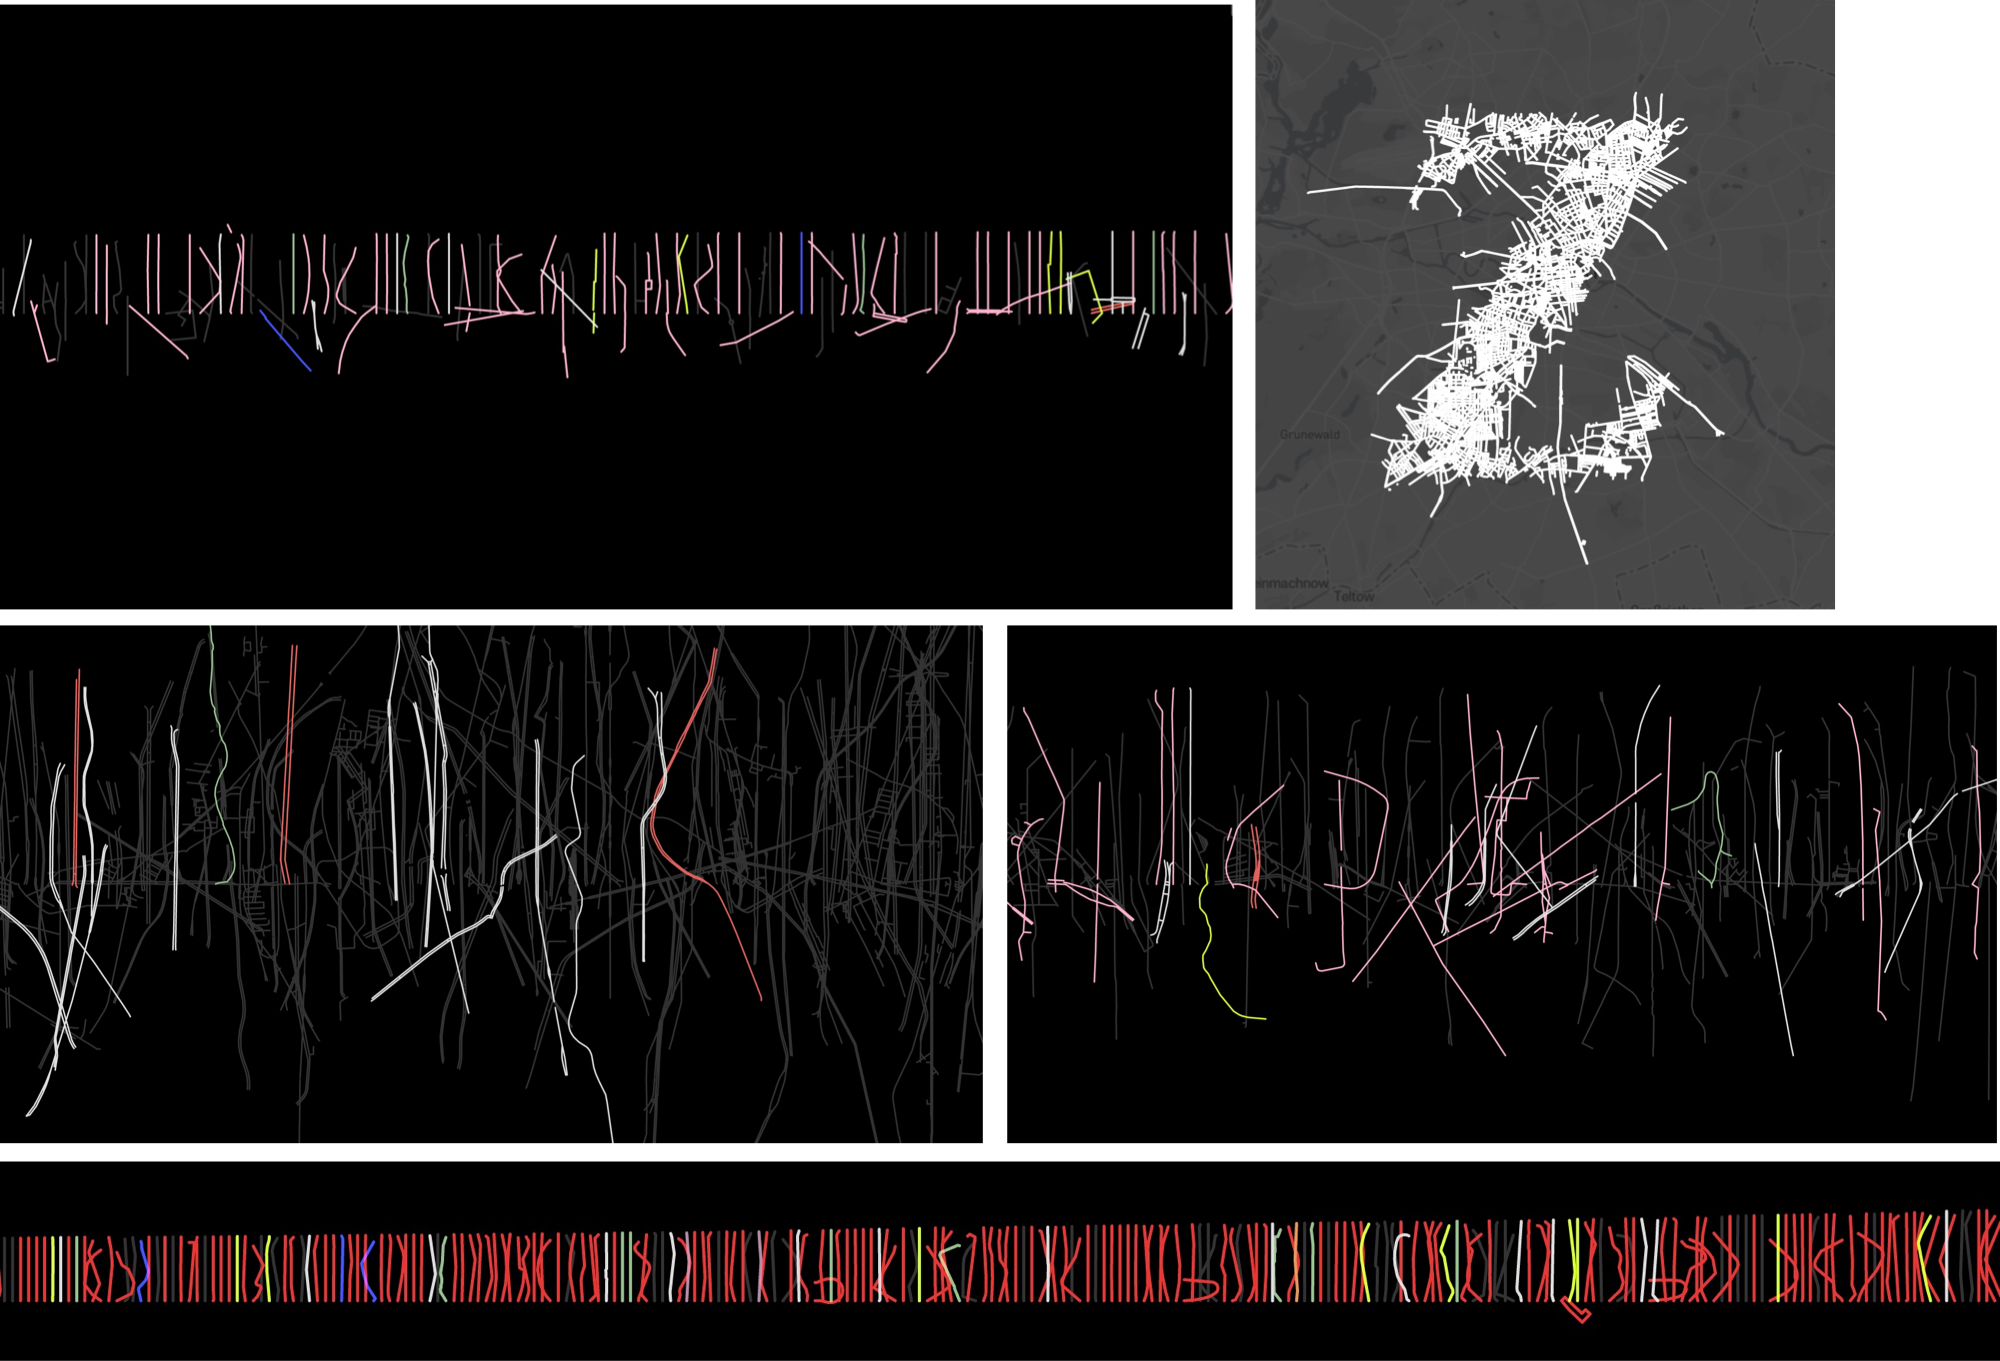
Sidestories: visual/artistic experiments with data
Since our dataset did not only contain the names of the streets but also their geometry, we researched alternative ways to find visualize the patterns we found. Here are some screenshots of my creative coding experiments:
Technologies used
Frontend: JQuery, Open Streetmap
Backend: Python, Django, GeoDjango
Links
- If you want to read more about the project: Here’s a description of the methodology and the data used for the project
- Information is Beautiful Award: https://www.informationisbeautifulawards.com/showcase/3135-streetscapes-mozart-marx-and-a-dictator